
A Comparison of Five Google Online Courses
September 5, 2013
Posted by Julia Wilkowski, Senior Instructional Designer
Quick links
Google has taught five open online courses in the past year, reaching nearly 400,000 interested students. In this post I will share observations from experiments with a year’s worth of these courses. We were particularly surprised by how the size of our courses evolved during the year; how students responded to a non-linear, problem-based MOOC; and the value that many students got out of the courses, even after the courses ended.
Observation #1: Course size
We have seen varying numbers of registered students in the courses. Our first two courses (Power Searching versions one and two) garnered significant interest with over 100,000 students registering for each course. Our more recent courses have attracted closer to 40,000 students each. It’s likely that this is a result of initial interest in MOOCs starting to decline as well as students realizing that online courses require significant commitment of time and effort. We’d like other MOOC content aggregators to share their results so that we can identify overall MOOC patterns.
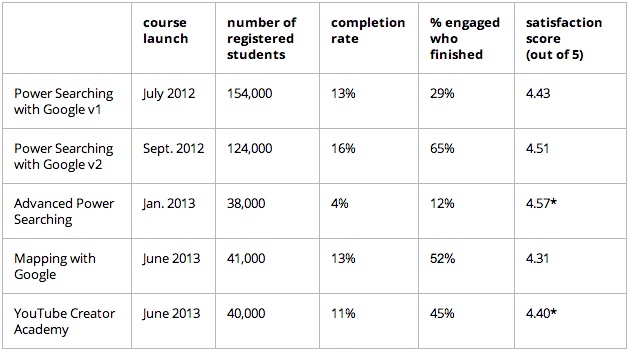 |
| *based on surveys sent only to course completers. Other satisfaction scores represent aggregate survey results sent to all registrants. |
Observation #2: Completion rates
Comparing these five two-week courses, we notice that most of them illustrate a completion rate (measured by the number of students who meet the course criteria for completion divided by the total number of registrants) of between 11-16%. Advanced Power Searching was an outlier at only 4%. Why? A possible answer can be found by comparing the culminating projects for each course: Power Searching consisted of students completing a multiple choice test; Advanced Power Searching students completed case studies of applying skills to research problems. After grading their work, students also had to solve a final search challenge.
Advanced Power Searching also differed from all of the other courses in the way it presented content and activities. Power Searching offered videos and activities in a highly structured, linear path; Advanced Power Searching presented students with a selection of challenges followed by supporting lessons. We observed a decreasing number of views on each challenge page similar to the pattern in the linear course (see figure 1).
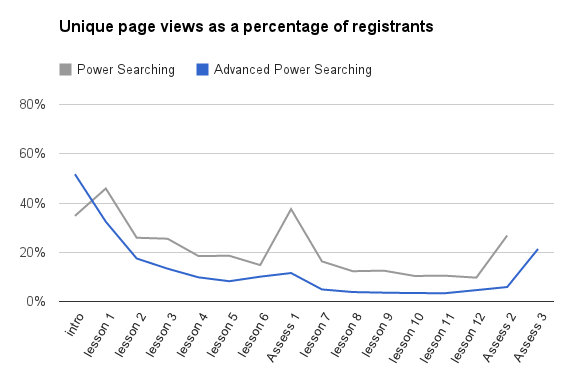 |
| Figure 1. Unique page views for Power Searching and Advanced Power Searching |
Students who did complete Advanced Power Searching expressed satisfaction with the course (95% of course completing students would recommend the course to others, compared with 94% of survey respondents from Power Searching). We surmise that the lower completion rate for Advanced Power Searching compared to Power Searching could be a result of the relative difficulty of this course (it assumed significantly more foundational knowledge than Power Searching), the unstructured nature of the course, or a combination of these and other factors.
Even though completion rates seem low when compared with traditional courses, we are excited about the sheer number of students we’ve reached through our courses (over 51,000 earning certificates of completion). If we offered the same content to classrooms of 30 students, it would take over four and a half years of daily classes to teach the same information!
Observation #3: Students have varied goals
We would also like to move the discussion beyond completion rates. We’ve noticed that students register for online courses for many different reasons. In Mapping with Google, we asked students to select a goal during registration. We discovered that
- 52% of registrants intended to complete the course
- 48% merely wanted to learn a few new things about Google’s mapping tools
- 78% of students achieved the goal they defined at registration
- 89% of students learned new features of Google Maps
- 76% reported learning new features of Google Earth
Observation #4: Continued interest in post-course access
After each course ended, we kept many of the course materials (videos, activities) available. Though we removed access to the forums, final projects/assessments, and teaching assistants, we have seen significant interest in the content as measured by Google and YouTube Analytics. The Power Searching course pages have generated nearly three million page views after the courses finished; viewers have watched over 160,000 hours (18 years!) of course videos. In the two months since Mapping with Google finished, we have seen over 70,000 unique visitors to the course pages.
In all of our courses, we saw a high number of students interested in learning online: 96% of Power Searching participants agreed or strongly agreed that they would take a course in a similar format. We have succeeded in teaching tens of thousands of students to be more savvy users of Google tools. Future posts will take an in-depth look at our experiments with self-graded assessments, community elements that enhance learning, and design elements that influence student success.
-
Labels:
- Education Innovation
Quick links
Other posts of interest
-

March 19, 2024
SCIN: A new resource for representative dermatology images- Education Innovation ·
- Health & Bioscience ·
- Open Source Models & Datasets
-

October 19, 2023
English learners can now practice speaking on Search- Education Innovation ·
- Product ·
- Speech Processing
-
October 26, 2022
Natural Language Assessment: A New Framework to Promote Education- Education Innovation ·
- Natural Language Processing